Enrichment analysis results
The results of the enrichment analysis are stored in a tab-separated matrix.txt text file. This is an NxM matrix, where N (rows) is the number of regulatory datasets, and M (columns) is the number of SNP sets. If one set of SNPs was analyzed, the matrix will contain 1 column.
Each cell of the matrix represents an enrichment p-value obtained from a set of SNPs vs. a regulatory dataset enrichment analysis. We employ hypergeometric distribution (Chi square test) to calculate the enrichment p-values and correct them for multiple testing using FDR. If an underrepresented enrichment is detected, the p-value is pre-fixed with a "-" sign. Before visualization, the matrix is filtered to remove rows (regulatory datasets) showing no statistically significant enrichments (at least a single condition with p-value < 0.01). The filtered matrix is then -log10-transformed, clustered using “Euclidean” distance to measure dissimilarity between rows and columns, and the “ward” agglomeration method, saved into the clustered.txt file and visualized as an interactive heatmap.
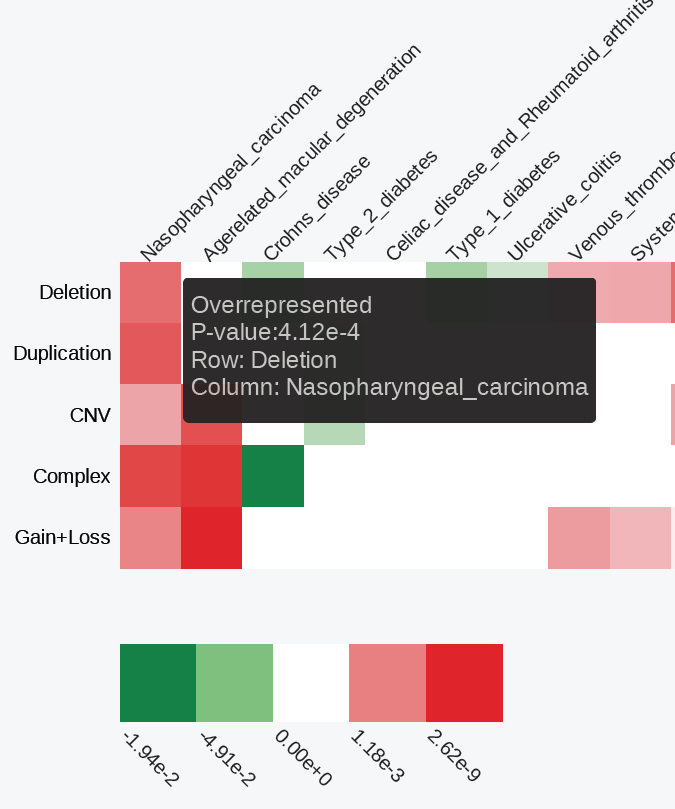
Red/green gradient highlights the level of significant enrichment/depletion, respectively. The matrix.txt and clustered.txt text files are available for download through the web interface and as a part of the command line module output.
The SNP set-specific detailed enrichment results are outputted into the separate text files in the enrichment subfolder. The files are named after the names of SNP set-specific files, e.g., if a "SLE.bed" file was analyzed, its detailed enrichment results will be outputted into "enrichment/SLE.txt" file.